The Hyperventilation Syndrome – Dr. Frances Ames Part IV
CHAPTER 6 - EXPERIMENTAL INVESTIGATION OF THE PERIPHERAL VASCULAR PHENOMENA OF THE HYPERVENTILATION SYNDROME
HISTORICAL REVIEW
It is more than 50 years since the association between deep breathing and peripheral vasoconstriction was first noted. Binet and Sollier (1895) were the first authors to mention that a diminution in finger volume occurred with deep breathing. In 1924 Uhlenbruck again mentioned this association.
In 1933 Goetz demonstrated that a single deep breath produced a profound peripheral constriction. Associated with this he recorded a decrease in skin temperature, a drop in the rate of blood flow, and a slowing, and, in some cases, a stasis in capillary blood flow.
In 1935 Goetz made a detailed study of the effects of a single deep breath and concluded that the diminution in blood flow was reflex since it was abolished by sympathectomy. Peters (1939) thought that the afferent stimulus came from the lungs themselves.
In 1936 the first comprehensive description in English was written by Bolton, Carmichael, and Sturup. They, like Goetz, thought that the diminution in finger volume was due to a reflex whose efferent path was the sympathetic and whose afferent stimulus probably resulted from the expansion of the chest wall. They did not obtain vasoconstriction with purely abdominal breathing.
In 1939 Mulinos and Shulman, using several different methods showed that a deep inspiration caused marked vasoconstriction of the arterioles of the forearm and hand. They observed a complete standstill of blood in the capillary tufts, persisting for 3 to 5 seconds, after a deep breath.
In 1948 Gilliat showed that the fall in systolic pressure which accompanies a deep breath was not responsible for the peripheral vasoconstriction. He then described the reflex vasoconstriction in detail - saying that a single deep breath caused a diminution in finger volume of the order of 0.5 - 1% while the volume of each pulse decreased to 50% or less of its former value. The latency of the response was about 3 seconds and the finger usually regained its previous volume in 60 seconds. The constriction also occurred with passive inflation of the chest and did not occur after obstructed inspiratory or expiratory efforts. He disagreed with Bolton et al. about the lack of response with abdominal breathing and claimed that vasoconstriction did occur with fast rates of abdominal breathing.
In a separate article in 1948, Gilliat attempted to define the exact afferent pathway of the reflex. After experimenting with paraplegics he concluded that the afferent pathway entered the spinal cord mainly in the upper thoracic region but the possibility that the "limits of entry are somewhat wider was not excluded".
The reflex peripheral vasoconstriction after a deep breath has been invoked to explain the peripheral vasoconstriction after a deep inhalation of an unlighted cigarette (Goetz, 1942) and has been used to test for any regeneration of sympathetic fibers after a sympathectomy.
METHODS AND MATERIAL
The state of the peripheral circulation under various conditions of breathing was studied.
Digital and pulse volumes were recorded by means of the optical digital plethysmograph described in detail by Goetz (1948). Briefly, the method consists of enclosing the finger or toe in a plethysmograph which is made airtight by sealing it with vaseline. The plethysmograph is connected to a specially made pipette graduated in 100ths of a ml. A column of alcohol is run into the pipette and any change in digital and pulse volume is transmitted to this column. The movements or the meniscus of the column are projected onto the paper of a recording camera. The .01 ml graduations of the pipette appear as white lines in the plethysmogram and serve as calibration for volume changes.
A 2-second time marker facilitates the calculation of the pulse rate. The respiratory tracing is recorded simultaneously by placing a cylinder of corrugated rubber around the subject's chest. This is connected by tubing to an all-metal pressure capsule, designed by Goetz, and any movement of the chest wall is reflected on the plethysmogram.
With this apparatus, the following can be read from the plethysmogram:
- The pulse volume and shape of the pulse wave
- The digital volume
- The pulse rate
- The depth, rate, and regularity of respiration
The venous congestion test was done on a finger using the method recommended by Goetz (1943). Briefly, the method consists of the sudden inflation to 50 - 60 mmHg of a cuff placed around the forearm. This amount of inflation is sufficient to impede the venous return without interfering with the arterial inflow. The venous bed of the finger is normally only partly filled and during the first few seconds of the test is able to take up the arterial input without resistance. Consequently, the rate of increase in volume during this period is, graphically, practically a straight line and the rate of blood flow can be calculated from it.
The gas flow was from a cylinder to a reservoir bag, connected to a B.M.R. mouthpiece via a nonreturn expiratory valve mounted at the mouthpiece. A B.M.R. nose clip was used. Warming and moistening the gas was done by introducing a Woulff's bottle containing warm water into the circuit.
Eight members of the series were used. Many of the normal controls were colleagues. All these subjects were free of organic vascular disease and stable enough to cooperate in the experiments. Some subjects were used several times.
Three patients who had had operations for removal of sympathetic ganglia were used. One of these had had a complete sympathectomy for hypertension. The other two were young women with acrocyanosis who were treated at varying intervals after a two-stage sympathectomy of the upper limbs.
All subjects reclined on a specially made couch with limbs nearly horizontal. They were instructed to relax in this position in a quiet dim room for 30 minutes before experiments were begun. The posture of the patient is important as marked changes in pulse volume result from a change in posture (Goetz and Ames, 1949. Goetz, 1950).
The normal plethysmogram
While the experimental part of this thesis is concerned with the peripheral vasoconstriction caused by deep breathing, certain other facts relating to changes in the peripheral vascular system are mentioned here because they may be important in the interpretation of some of the results obtained.
- In the normal subject, even at rest, digital and pulse volume may show waxing and waning which coincides with the respiratory cycle. These changes are usually explained as a result of the proximity of the vasomotor and respiratory centers in the medulla. (Fig. 4.) The changes can be induced or accentuated in a normal subject by adding CO2 to the mixture breathed (Fig. 10 ( b)).
Fig. 4. Flethysmogrrun of left 'index finger (upper tracing) and left big toe (lower tracing). The subject at rest. Note fluctuations in digital and pulse volume with respiration.
Goetz (1937) suggested that this did not result from the increased depth of respiration with CO2 but that the CO2 itself acted as a vasomotor stimulant.
- In addition, there are certain well-known extrinsic stimuli causing peripheral vasoconstriction. These are mental activity; any sensory stimulus, e.g. pain; noise; a yawn; a sigh. Mental activity and a sensory stimulus produce a similar plethysmographic response. The peripheral vasoconstriction caused by them comes about independently of respiration. The degree and duration of the vasoconstriction are similar to that caused by a single deep breath ( Fig. 5 and 6). A yawn and a sigh are in effect variants of a deep breath.
INVESTIGATIONS
Three aspects of the peripheral vasoconstriction associated with breathing were investigated.
- The effect of variations in a single breath.
- The effect of 2 minutes of overbreathing.
- The effect of overbreathing:
(a) in ten subjects with one hand cooled and the other warmed.
(b) in ten subjects with elevated limbs.
(c) in two subjects with acrocyanosis. at varying intervals, after the upper limbs had been sympathectomized.
(d) in a subject with total sympathectomy.
1. The effect of variations in a single breath
(a) The usual response to a single deep breath is a considerable reduction in pulse volume. This occurs about 3 seconds after inspiration has begun and appears to coincide with the climax of the inspiratory phase. It is maximal from the beginning and a return to the original pulse volume takes about 30 seconds. (Fig. 7).
The vasomotor tone is normally higher in the legs than in the arms if the subject is standing or reclining. As the subjects were reclining during these experiments toes were recorded less frequently than fingers because their low initial pulse volume made some of the results difficult to interpret.
The fact that toes do also constrict rules out the possibility that the vasoconstriction is due to compression of arm arteries by the movement of the shoulder girdle that accompanies a deep breath. (Fig. 8)
Coinciding with the diminution in pulse volume there is a corresponding reduction in arterial inflow, (Fig. 9 (a), (b), and (c)).
Fig. 5. Plethysmogram of the left index finger. Subject doing mental arithmetic. The period of calculation is indicated by the numbers. Note the vasoconstriction which begins while the subject is being given the calculation.
Fig. 6. Plethysmogram of the left index finger. A sudden noise was made by dropping a basin. Duration of the noise indicated by vertical white lines. Note the vasoconstriction.
Fig. 7. - Plethysmogram of the left index finger. Subject instructed to take one deep breath. Note vasoconstriction which takes a few seconds to occur and is considerable.

Fig. 8. - Plethysmogram of the left index finger (lower tracing) and left big toe (upper tracing). Subject instructed to take one deep breath. Note vasoconstriction in the toe as well as the finger.
(b) This characteristic peripheral vasoconstriction after a deep breath occurred whether air, oxygen, or a mixture of air and 4 1/2 percent CO2 was breathed. (Fig. 10 (a), (b) and (c)).
It also occurred if the inspired gas was warm and moist or cold and dry. This latter point is of some importance as a cold stimulus to the sensitive nasal mucous membrane sometimes produces reflex vasoconstriction.
(c) The depth of breath is important. Vasoconstriction did not occur with a deeper than normal but still fairly small breath. (Fig. 11 (a) and (b)). It did occur, however, with rapid, shallow breathing. (Fig. 12).
(d) Vasoconstriction did occur with an attempt to take a deep breath against a closed glottis. (Fig.13).
(e) Vasoconstriction did not occur with a purely abdominal breath. This is not surprising because the breath taken in this way was always a small one.
(f) Vasoconstriction did not occur in limbs to which the sympathetic supply had been removed. This supports the commonly accepted view that the afferent path for the vasoconstrictor reflex is sympathetic. (Fig. 14 (a) and (b)).
(g) The response to a single deep breath was compared in eight normals and eight hyperventilators. Subjects were matched for age and sex as far as possible. (Table l).
A summary of the results shows that in normals, the average initial pulse volume was 0.0151 ml, a single deep breath reduced this to 0.0073 ml., and this vasoconstriction persisted for an average of 30 seconds. In hyperventilators the average initial pulse volume was 0.0083 ml, a single deep breath reduced it to 0.0037 ml, and this vasoconstriction persisted for an average of 24 seconds.
Fig. 9. (a) and (b) Plethysmogram or right index finger during venous congestion tests. Note that in (a) the pulse tracing shifts upwards at almost 90 degrees, reflecting a rapid increase in digital volume and consequently a rapid arterial inflow. In (b) the tracing moves upwards at an angle of about 45 degrees, showing the slower arterial inflow following the vasoconstriction after one deep breath.
Fig. 9. (c) Plethysmogram of right index finger during venous congestion test after two minutes hyperventilation. Fig. 10 (a) Plethysmogram of the left index finger. Subject breathing air. One deep breath was taken. The apnoea is voluntary. Note vasoconstriction.
Fig. 10 (a) - Plethysmogram of the left index finger. Subjects breathing air. One dee breath
was taken. The apnoea is voluntary. Note vasoconstriction.
Fig. 10 (b) - Plethysmogram of the left index finger. Subject breathing a mixture of air and CO2 (4 percent). One deep breath is taken. The apnoea is voluntary. Note vasoconstriction. Also, note the appearance of spontaneous fluctuations in digital and pu~se vol e. The same subject was used for fig 10 (a) and fig. 10 (b). Both tracings were recorded during the same experiment.
Fig. 10 (c) - Plethysmogram of the left index finger. Subject breathing oxygen. One deep breath was taken. Note the vasoconstriction.
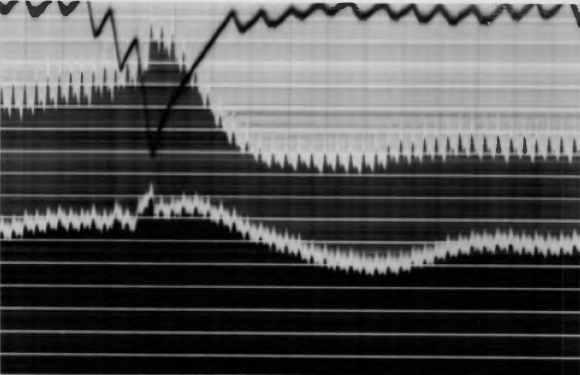
Fig. 11 (a) - Plethysmogram of the left index finger (upper tracing) and left big toe (lower tracing). One deep breath was taken. Note the vasoconstriction.
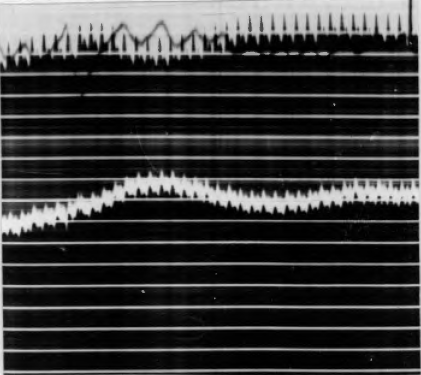
Fig. 11 (b) - Plethysmogram of the left index finger and left big toe. The subject used was the same in Fig. 11 (a). Both tracings were recorded during one experiment. Subject instructed to take a moderately deep breath. No vasoconstriction occurred.

Fig. 12. Plethysmogram of the left index finger. Subject instructed to breathe rapidly and shallowly. Note the vasoconstriction.

Fig. 13. Plethysmogram or left big toe. Subject instructed to attempt a deep breath against a closed glottis. Note the vasoconstriction and shift in the respiratory tracing indicating the extent of the chest expansion.
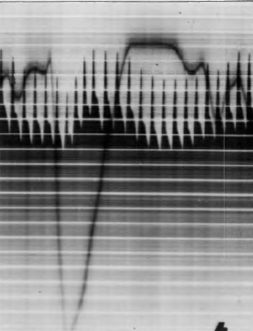
Fig. 14 (a) Plethysmogram of the left big toe of a patient who had had a lumbar sympathectomy done a few weeks before the experiment. No vasoconstriction occurred with one deep breath.
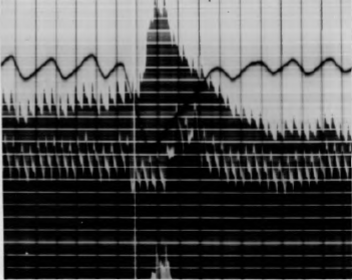
Fig. 14 (b) Plethysmogram of the left index finger (upper tracing) and left big toe (lower tracing) of a patient who had had a lumbar sympathectomy several months before the experiment. He had no occlusive vascular disease. Note vasoconstriction occurs in the finger but not in the toe after one deep breath.
Previous Chapter
Chapter 4 - Diagnosis and Differential Diagnosis
Next Chapter
Chapter 6 - Experimental Section Continued


